
Here’s a number that tends to get business owners’ attention: a large share of visitors will abandon a mobile page if it takes longer than a few seconds to become usable, and that abandonment rate climbs sharply for every additional second of delay. Speed isn’t a “nice to have” anymore — it’s a measurable, quantifiable factor in both search rankings and revenue.
Core Web Vitals are Google’s attempt to turn “does this page feel fast and stable to use” into something measurable and comparable across the entire web. They’re not the only ranking factor, and they won’t single-handedly fix a site with weak content or poor keyword targeting — but for two sites competing closely on everything else, Core Web Vitals performance can genuinely be the deciding factor.
This guide breaks down what each metric actually measures, why it matters beyond just SEO, and the specific, practical fixes that move the needle — without requiring a computer science degree to follow along.
What Core Web Vitals Actually Measure
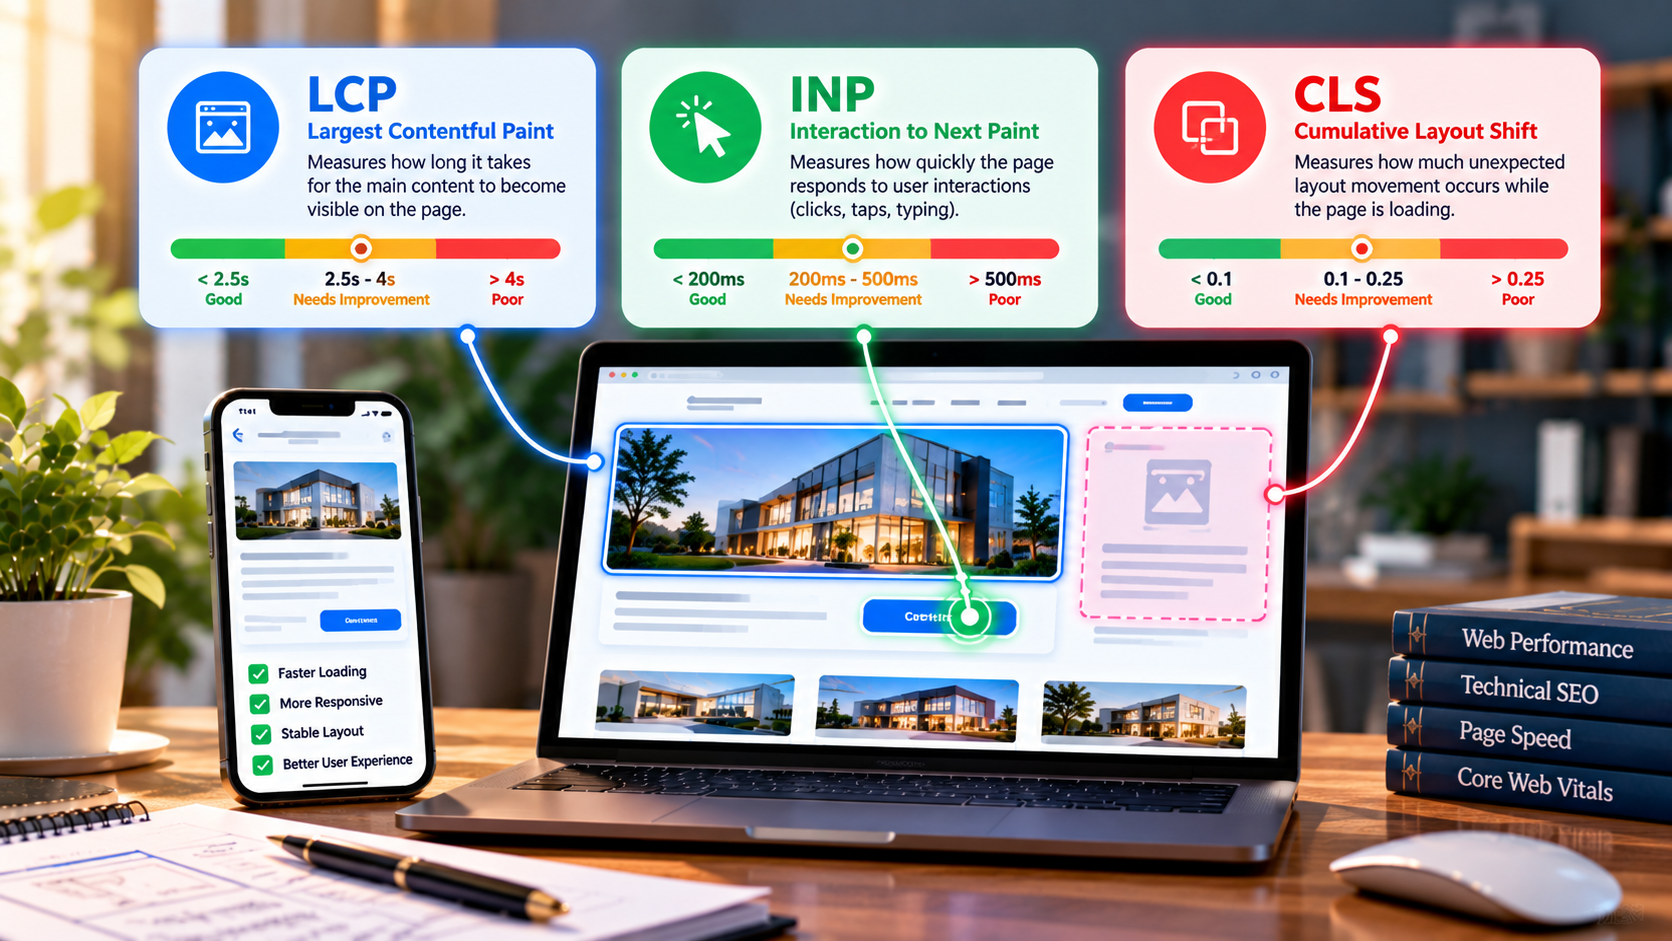
Google currently tracks three core metrics, each measuring a different dimension of user experience:
Largest Contentful Paint (LCP) — “How fast does the main content load?”
LCP measures how long it takes for the largest visible element on the page — usually a hero image, a header, or a large block of text — to fully render. This is essentially a proxy for “when does this page feel like it’s actually loaded” from a visitor’s perspective.
Good benchmark: under 2.5 seconds What commonly causes poor LCP: unoptimized hero images, slow server response times, render-blocking CSS or JavaScript loaded before the main content
Interaction to Next Paint (INP) — “How responsive is the page when I actually try to use it?”
INP measures the delay between a user’s interaction (tapping a button, opening a menu, filling a form field) and the page visibly responding. This replaced the older First Input Delay (FID) metric because it captures responsiveness across the entire page visit, not just the very first interaction.
Good benchmark: under 200 milliseconds What commonly causes poor INP: heavy JavaScript execution blocking the browser’s main thread, poorly optimized third-party scripts (chat widgets, ad tags, analytics tools stacked on top of each other)
Cumulative Layout Shift (CLS) — “Does the page jump around while I’m trying to use it?”
CLS measures unexpected visual shifts — the frustrating moment when you go to tap a button and an ad loads above it, pushing everything down just as you tap, so you click the wrong thing.
Good benchmark: under 0.1 What commonly causes poor CLS: images or ads without reserved space/dimensions, web fonts that load and shift text after the page renders, dynamically injected content (banners, cookie notices) with no allocated space
You can check your current Core Web Vitals performance directly through Google’s PageSpeed Insights tool, which reports both lab data (a simulated test) and, where available, real-world field data collected from actual visitors.
Why This Matters Beyond Just Rankings
It’s worth being precise here: Core Web Vitals are a confirmed ranking signal, but a relatively modest one on their own compared to content relevance and overall site authority. The bigger, often underestimated impact is on conversion and user behavior directly:
- Slower pages consistently show higher bounce rates and lower average session duration
- Poor INP directly frustrates users trying to complete an action — filling a contact form, adding to cart, tapping a phone number — which costs conversions regardless of whether it costs rankings
- Layout shift-driven mis-clicks (tapping the wrong element because the page moved) create a genuinely bad user experience that erodes trust in the brand, not just the page
In other words: even if Core Web Vitals moved zero ranking positions, fixing them would still be worth doing purely for the conversion and retention impact.
Step 1: Diagnose Before You Fix
Before touching anything, get a clear, honest read on where your site currently stands:
- Run your key pages (homepage, top landing pages, highest-traffic blog posts) through PageSpeed Insights for both mobile and desktop
- Check Google Search Console’s Core Web Vitals report for a site-wide view of how many URLs fall into “Good,” “Needs Improvement,” and “Poor” buckets
- Prioritize fixes based on traffic volume, not just severity — a moderately slow page getting thousands of visits matters more than a severely slow page nobody visits
This diagnostic step alone often reveals that the problem is concentrated in a handful of templates (a specific page type, a particular plugin, one heavy third-party script) rather than being evenly spread across the whole site — which makes the fix far more targeted than it initially seems.
Step 2: Fixing LCP (Load Speed)
- Compress and properly size images — a hero image doesn’t need to be a multi-megabyte, full-resolution file; modern formats (WebP, AVIF) typically cut file size significantly with no visible quality loss
- Use a content delivery network (CDN) to serve assets from a location physically closer to the visitor, reducing latency
- Eliminate render-blocking resources — CSS and JavaScript that must fully load before the browser can display anything should be deferred or loaded asynchronously wherever possible
- Upgrade hosting if server response time itself is the bottleneck — no amount of front-end optimization compensates for a slow server responding to the initial request
- Preload critical assets (like the hero image or key fonts) so the browser prioritizes them earlier in the loading sequence
Step 3: Fixing INP (Interactivity)
- Audit and trim third-party scripts — chat widgets, heat-mapping tools, multiple analytics platforms, and ad tags often stack up over time without anyone reviewing whether they’re all still necessary
- Break up long JavaScript tasks so the browser’s main thread isn’t locked up processing one large script while a user tries to interact with the page
- Defer non-critical JavaScript until after the main content has loaded and become interactive
- Reduce unnecessary re-renders on interactive elements (common on sites built with heavier JavaScript frameworks that aren’t carefully optimized)
Step 4: Fixing CLS (Visual Stability)
- Always specify width and height attributes (or use CSS aspect-ratio) for images and embedded video, so the browser reserves the correct space before the asset loads
- Reserve space for ads and dynamic content in advance, rather than letting them push existing content down when they load
- Load web fonts carefully using font-display strategies that minimize the visible “flash” of unstyled or substituted text shifting the layout
- Avoid inserting new content above existing content (banners, notification bars, cookie consent) after the initial page load, unless the space is already reserved
Step 5: Build Speed Into Your Process, Not Just a One-Time Fix
Core Web Vitals scores drift over time as new plugins, tracking scripts, and content get added without anyone monitoring the cumulative impact. A sustainable approach includes:
- Reviewing Core Web Vitals performance on a recurring basis (monthly or quarterly), not just once during a redesign
- Setting a policy for adding new third-party scripts — every chat widget, tracking pixel, or embed should be evaluated for its performance cost, not just its feature value
- Testing performance impact before launching new page templates or major design changes, rather than discovering the regression after it’s live
This is one of the areas where technical SEO and web design decisions genuinely can’t be separated — a beautifully designed page that loads slowly or shifts around during load undermines both the design and the SEO investment behind it. If your site’s underlying build needs attention beyond just Core Web Vitals, our web design services team builds performance considerations in from the foundation rather than bolting them on afterward.
How Core Web Vitals Fit Into Your Broader SEO Strategy
It’s worth being realistic: fixing Core Web Vitals on a site with thin, unhelpful content or no topical authority won’t produce dramatic ranking gains on its own. Core Web Vitals work best as one piece of a complete technical foundation — alongside proper site structure, crawlability, and mobile usability — that then lets genuinely strong content and authority signals perform to their full potential. Our broader technical SEO guide covers how these pieces fit together, and our SEO services team typically starts any engagement with exactly this kind of full technical audit before touching content or links.
Common Core Web Vitals Mistakes
- Chasing a perfect lab score in PageSpeed Insights while ignoring real-world field data from actual visitors, which is what Google actually uses for ranking purposes
- Fixing the homepage only, while high-traffic landing pages and blog posts remain slow
- Adding a new tracking script or widget without testing its performance cost — these accumulate silently over months
- Treating image compression as a one-time task rather than a standard step in every content and design workflow going forward
- Ignoring mobile scores because desktop looks fine — the majority of traffic and Google’s primary evaluation is mobile-first
Bringing It All Together
Core Web Vitals translate an abstract idea — “does this page feel good to use” — into concrete, fixable metrics. None of the fixes require reinventing your website; they require a disciplined audit, prioritized fixes on your highest-traffic templates, and an ongoing process to prevent new scripts and content from quietly eroding performance again. The payoff shows up in two places at once: incrementally better rankings, and a measurably better conversion rate from the same traffic you’re already getting.
If you’d like a clear, prioritized breakdown of exactly what’s slowing your site down, you can request a free SEO audit report and we’ll show you precisely where the highest-impact fixes are.
